●Case study / 02← Back to index
Northwind Atlas.
An interactive atlas that turns 30 years of climate research into something a journalist can read in an afternoon.
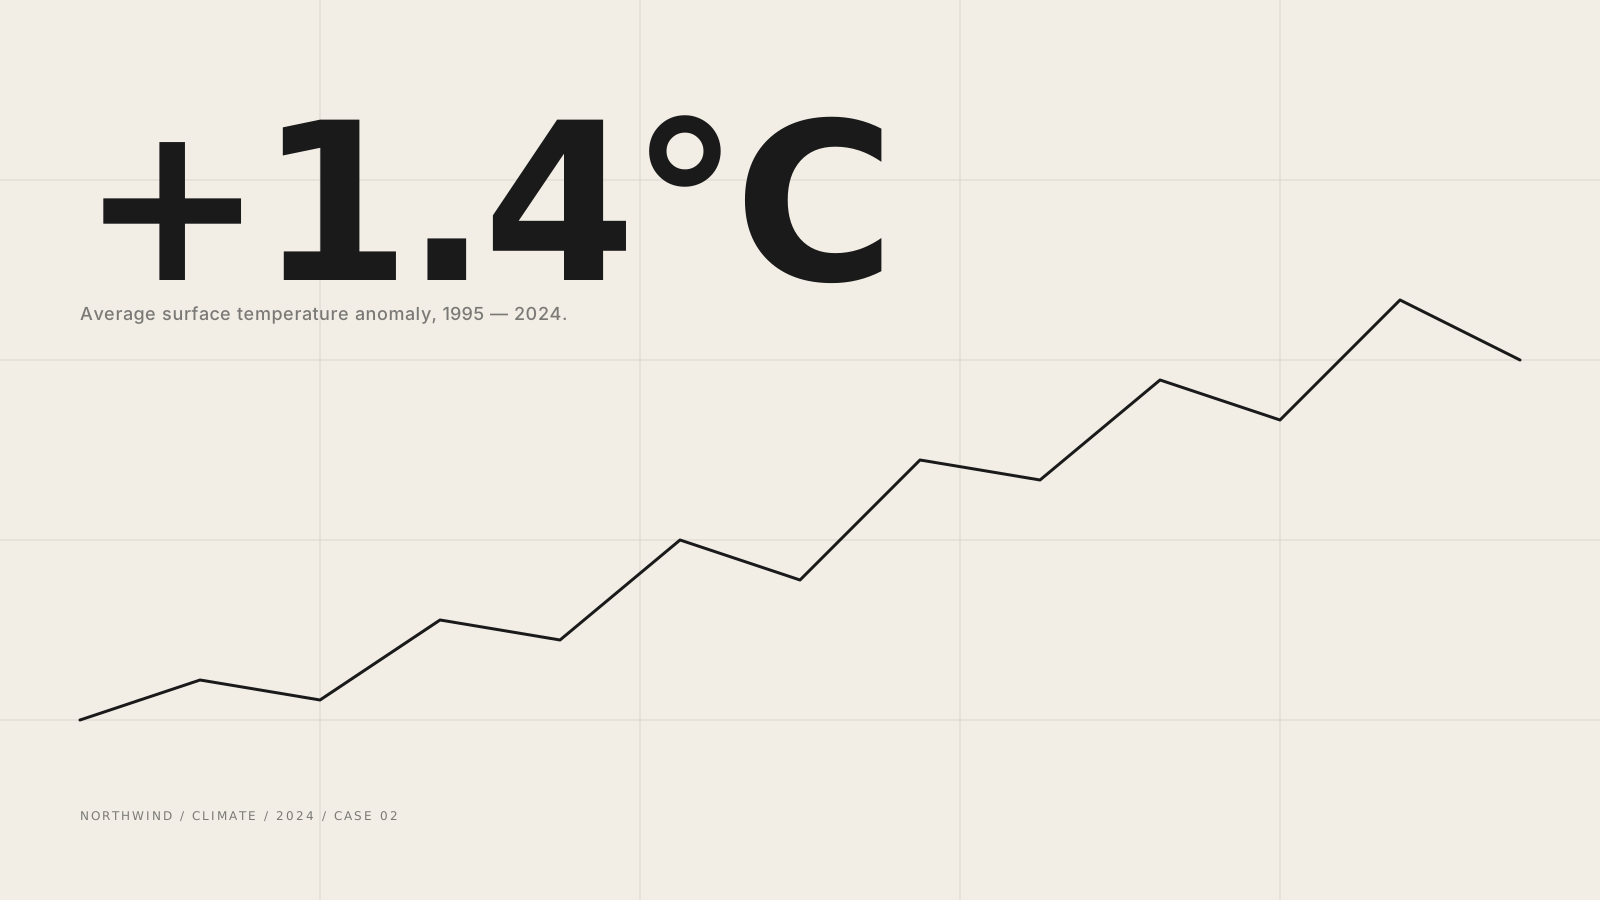
Northwind had thirty years of climate data and a single PDF report. We were asked to design a reading surface — somewhere a reporter could come in cold, find a story, and walk out with a chart they could defend.
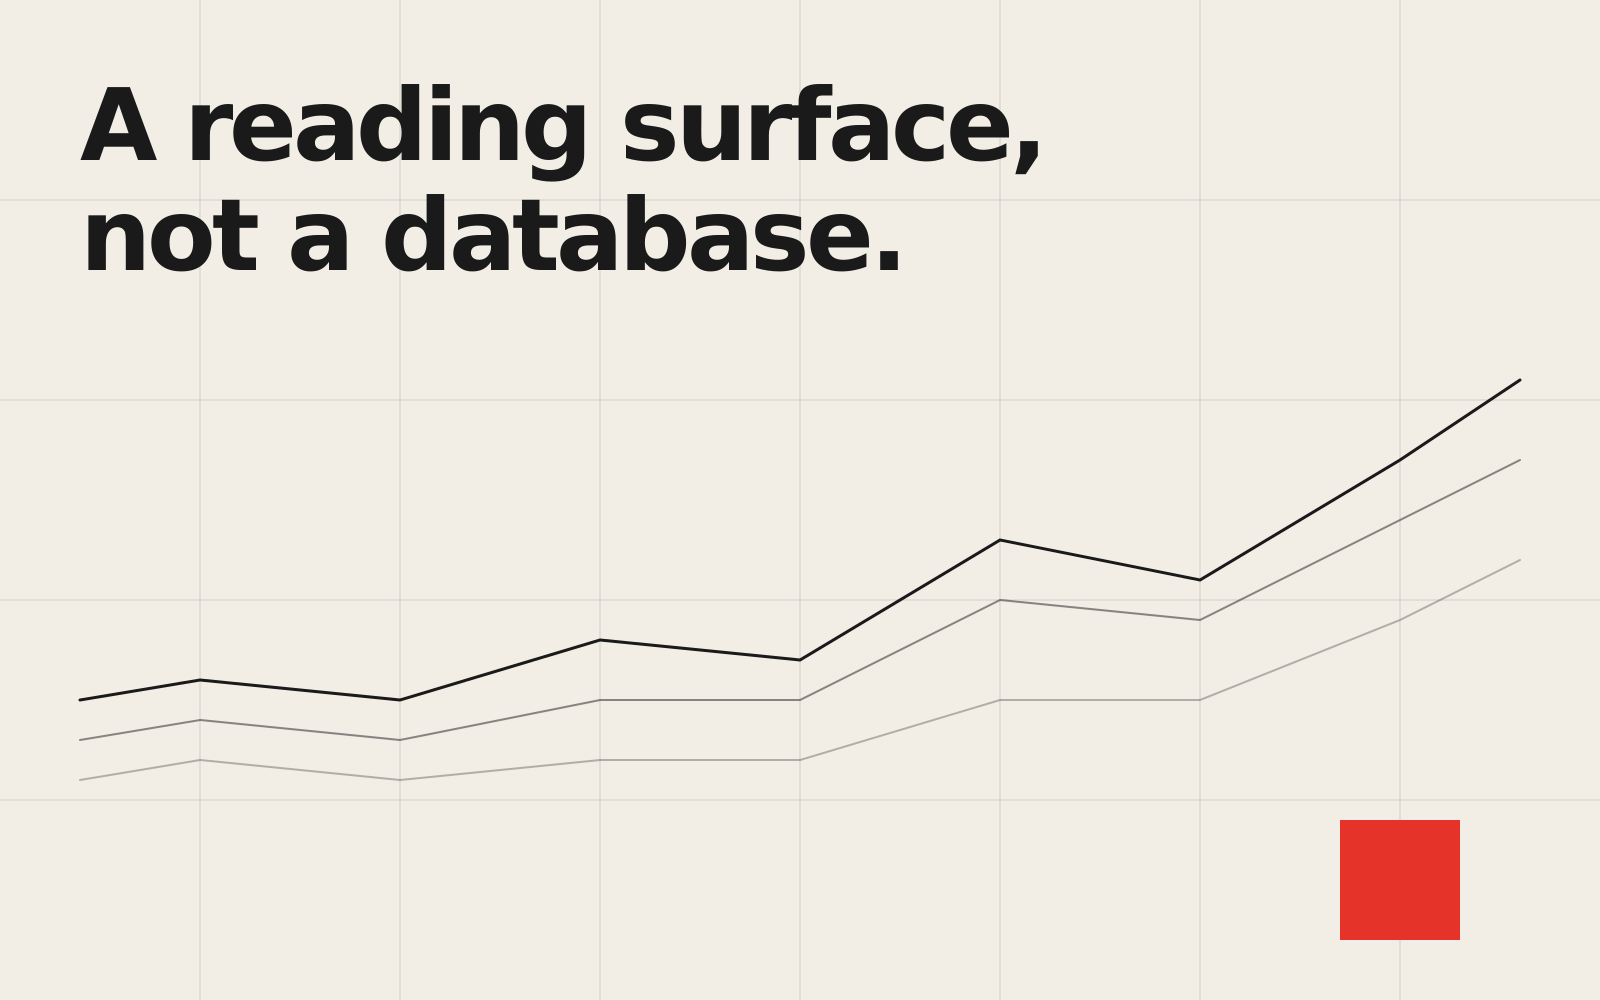
We treated the atlas as a magazine that happened to be interactive. Each dataset is introduced by a short essay, then opened into a chart that explains itself.
The reading model is the product. We resisted feature sprawl in favor of a single, deliberate path from question to evidence.
- 01Designed the editorial grid for long-form data essays
- 02Built a typographic scale that holds up at four densities
- 03Defined the chart grammar that all 1.4M datasets speak
Press citations
240+
Datasets indexed
1.4M
Avg session
11 min
TagsInformation designData vizEditorial